Five years ago, the iPhone ushered in the era of mobile computing. Today, more than a billion consumers are “glued” to these devices and their applications, impacting nearly every aspect of their lives. For businesses, opportunities seem endless and disruption is everywhere. The list of disrupted industries is long, including communications, media and entertainment, logistics, education and healthcare, just to name a few.
Since its launch in 2008, Flurry analytics and ad platform has been integrated in to more than 300,000 applications and measuring usage on more than 1 billion monthly active smart devices. On its five year anniversary, folks at Flurry are sharing some insights on the industry.
Here are the highlights:
- The U.S. consumer spends an average of 2 hours and 38 minutes per day on smartphones and tablets.
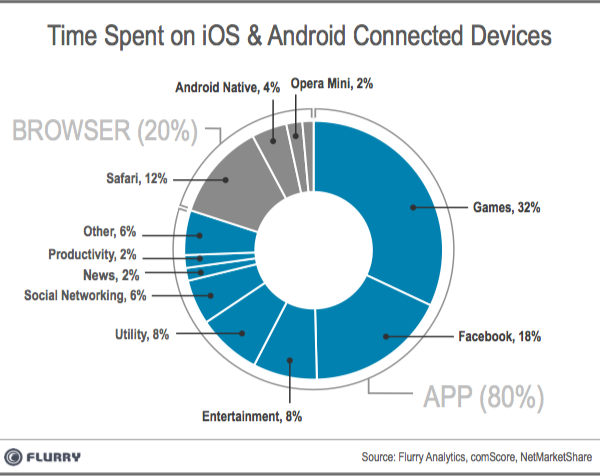
- 80% of that time (2 hours and 7 minutes) is spent inside apps and 20% (31 minutes) is spent on the mobile web.
- All mobile browsers combined, which we now consider apps, control 20% of the consumers’ time.
- Gaming apps remain the largest category of all apps with 32% of time spent.
- Facebook is second with 18%, and Safari is 3rd with 12%
- Worth noting is that a lot of people consume web content from inside the Facebook app. For example, when a Facebook user clicks on a friend’s link or article, that content is shown inside its web view without launching a native web browser (e.g., Safari, Android or Chrome), which keeps the user in the app.
So if we return to the chart and consider the proportion of Facebook app usage that is within their web view (aka browser), then we can assert that Facebook has become the most adopted browser in terms of consumer time spent.
The App World
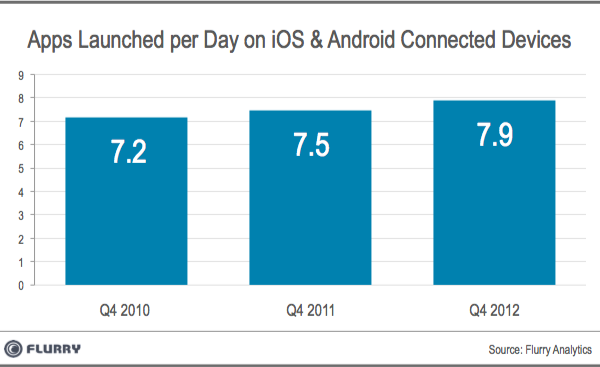
Five years into its existence, the app economy is thriving, with The Wall Street Journal recently estimating annual revenue of $25 billion. Flurry’s next insight comes from studying how many apps the average consumer launches each day. For this snapshot, it compared three years of worldwide data, taking the 4th quarters of 2010, 2011 and 2012.
From left to right, we see that the average number of apps launched per day by consumers climbs from 7.2 in 2010 to 7.5 in 2011 and finally to 7.9 in 2012.
While one could observe that consumers use only 8 apps per day among the million+ available between the AppStore and Google Play, one also needs to remember that the 8 apps each consumer uses varies widely. This creates a marketplace that can support diversified apps.
The Web World
Looking again at the first chart in this study, while also considering the latest numbers from IDC, which projects that tablets will outsell desktops this year and notebooks next year, we draw the conclusion that the web, as we know it, is already facing a serious challenge.
Of course, that doesn’t mean the web will die. It is definitely sure that the web will change and adapt to the reality of smartphones and tablets.
Websites will look and behave more like apps. Web sites will be optimized for user experience first and search engine optimization second.
… and Facebook
Continuing to think about the first chart, it appears that mobile, once perceived as Facebook’s Achilles’ heel, has become Facebook’s biggest opportunity. Consumers are spending an average of nearly 30 minutes per day on Facebook. Add to that Facebook’s massive reach, as well as their roughly billion mobile users per month and you have a sizable mobile black hole sucking up peoples’ time. The 30 minutes a day is a worldwide average which means a large group spends even more time on Facebook (possibly hours) watching and participating in what has become the ultimate reality show in which the actors are you and your friends.
The disruptive force of the mobile app economy has created opportunities, rising stars, instant millionaires, dinosaurs and plenty of confusion. However, one undeniable truth is that tablets and smartphones are eating up desktops, and notebooks and apps (including the Facebook app) are eating up the web and peoples’ time.
Via: Flurry Blog


